
Elevation Dashboard Updates: What’s Changed and Why
With the release of the new Elevation Dashboard, we’ve made several improvements to how your data is shown and interpreted, all based on user feedback and designed to help you take more meaningful action.
Below, we’ve outlined what’s changed, why these changes have been made, and what they mean for you.
The homepage and dashboard have been redesigned for clarity and actionability, making it easier to help you interpret your data quickly and take the right next steps with confidence.
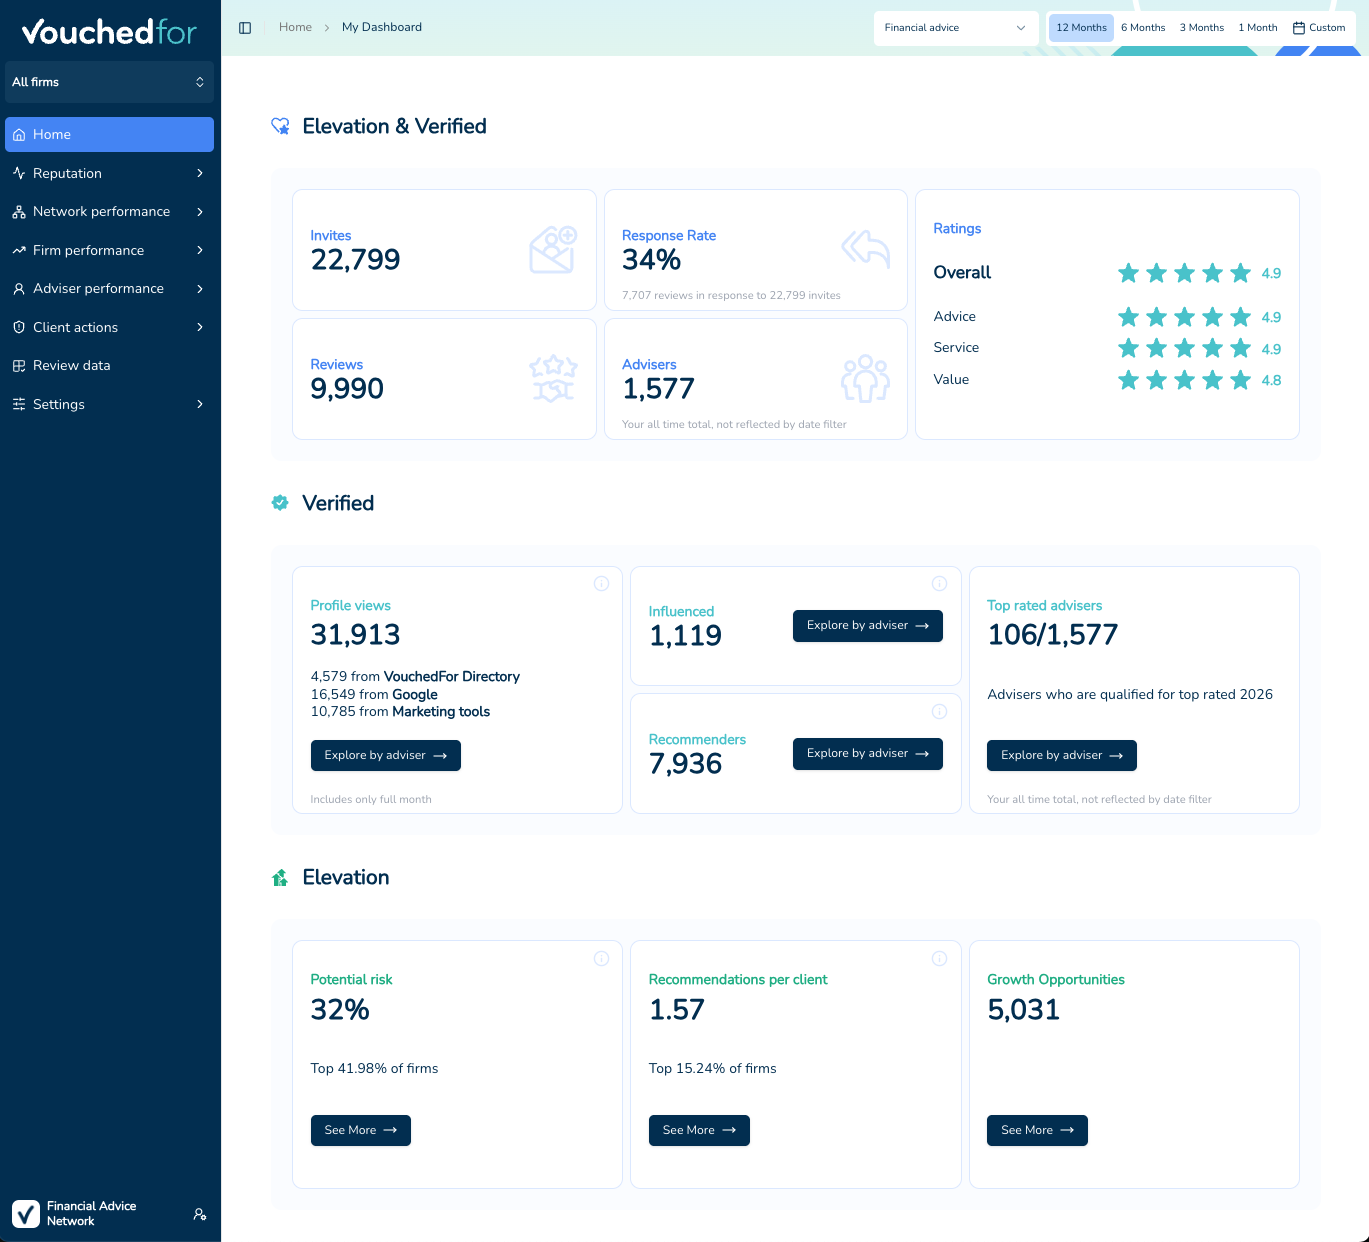
Your scores will now look a bit different; see a detailed explanation below of what’s changed in how your data is presented.
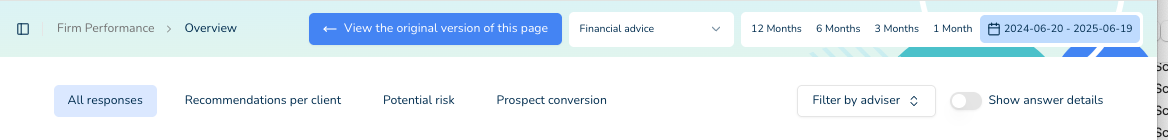
Note that you can temporarily switch between the new and old versions of the Elevation dashboard to compare views if needed with the button “View the original version of this page”. This will be available for the next few months whilst we update the rest of the product and the reports.
Goals & Drivers
Advocacy goal
What’s changed?
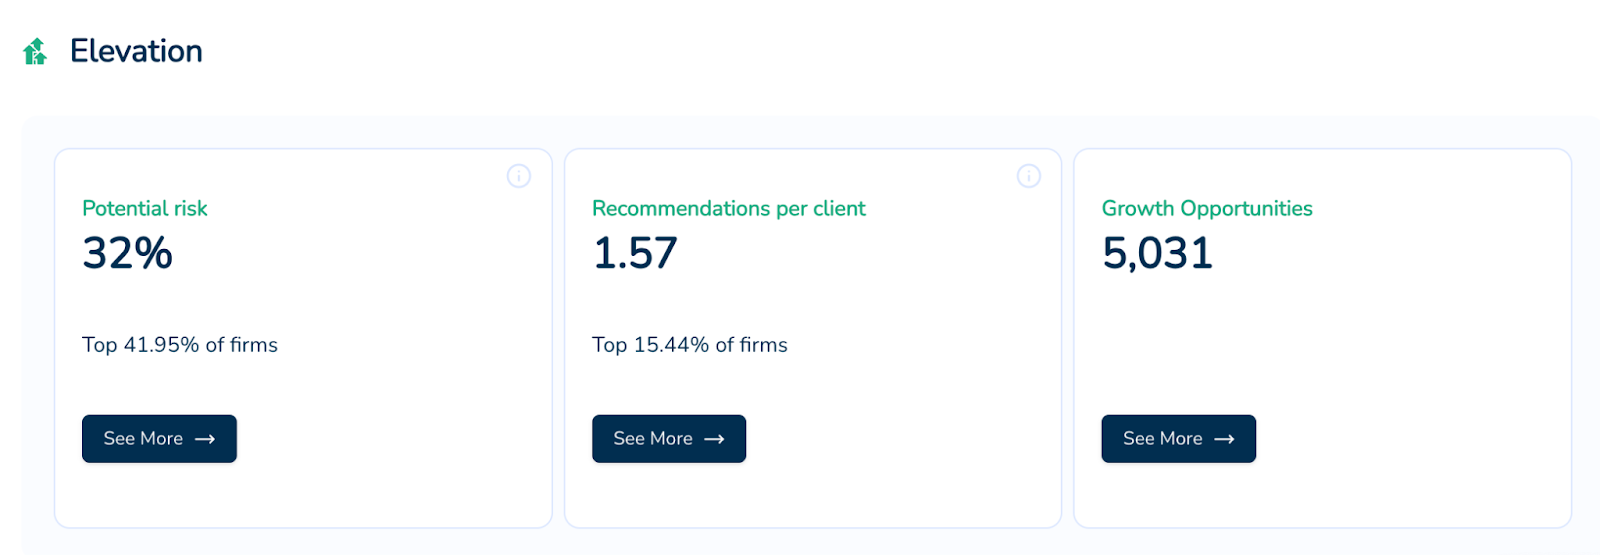
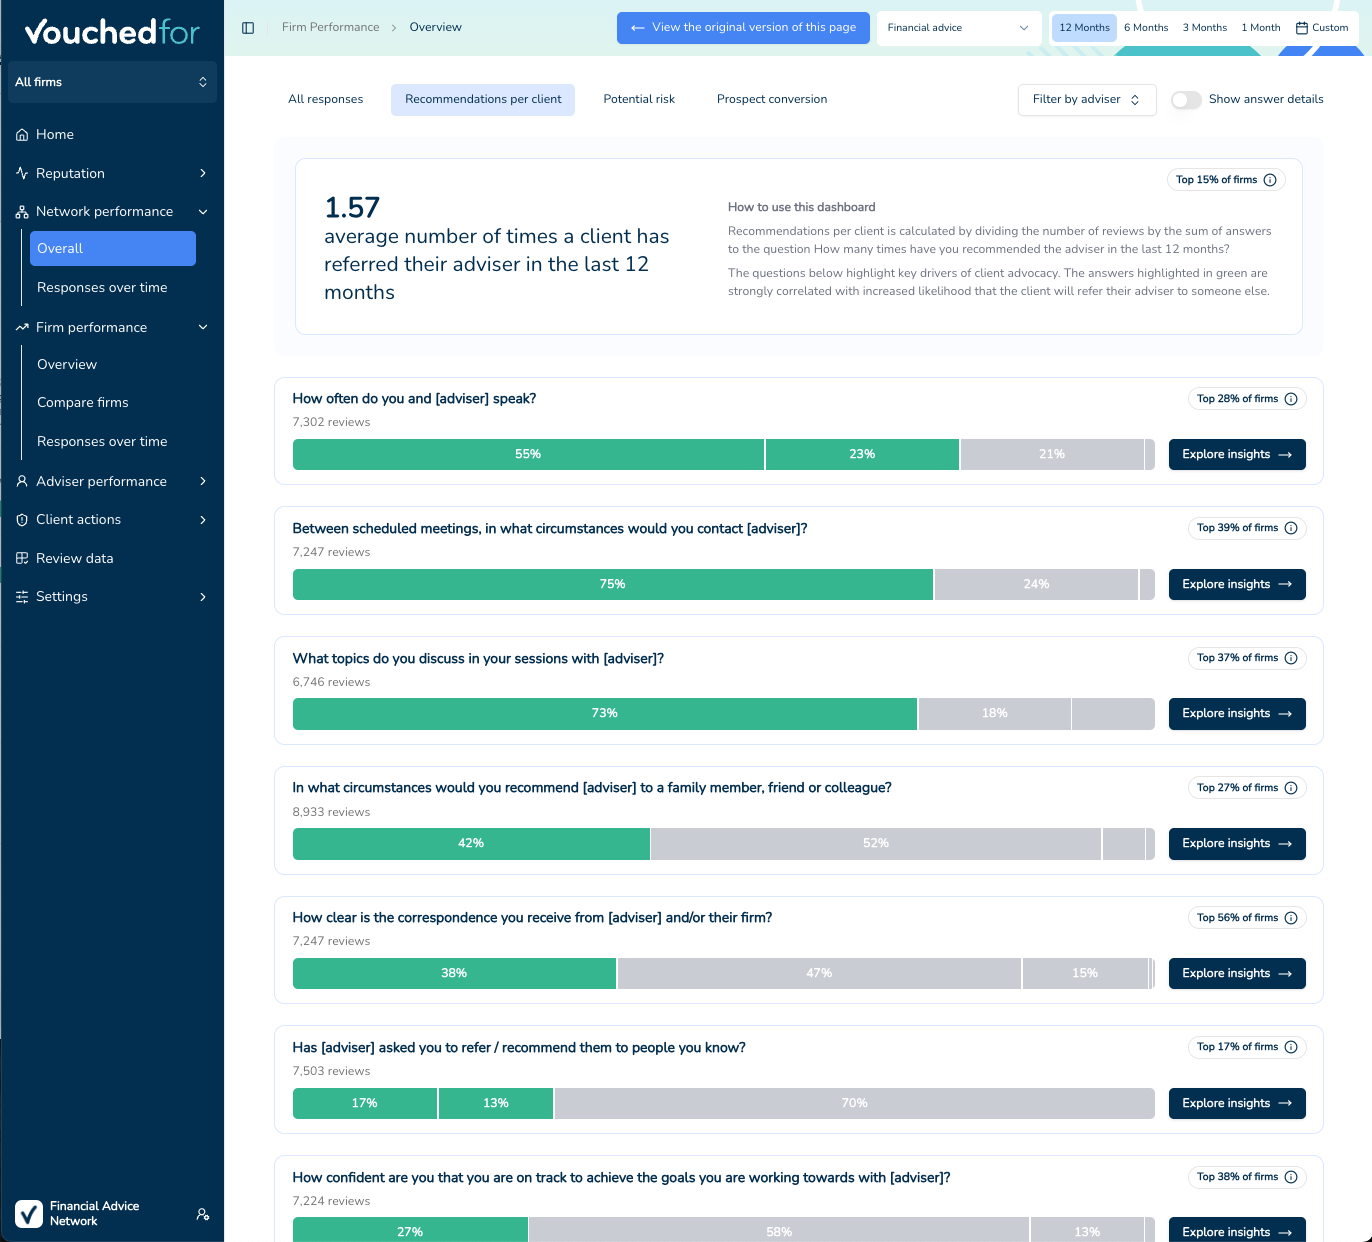
We’ve replaced “passionate advocates” as a headline metric with “number of recommendations.”
Why is the number of recommendations better?
Recommendations are a clearer, more tangible signal of organic growth. Recommendations per client is calculated by dividing the number of reviews by the sum of answers to the question “How many times have you recommended the adviser in the last 12 months?”
You can still track the percentage of clients who are passionate advocates as a driver of the new goal, but the focus is now on actual outcomes.
Risk goal
What’s changed?
We’ve simplified how risk is measured.
Your Potential Risk metric now shows the number of reviews with a risk, not those without.
If any risky answer is given in a review, the whole review is now flagged as risky (previously, VouchedFor assigned different “grades” of risk e.g. if a risk was deemed as “medium”, there would need to be three risky answers for the review to be marked as risky).
Why is the new risk score better?
We’ve simplified how risk is shown to make it easier to understand and act on. In the new system, every risky answer counts. This removes hidden thresholds and makes risk easier to understand and act on.
Due to removing “grades” of risk, more reviews will be labelled as risky. Thus, you will see your risk score rise, but don't worry, every other firm will also see this change. Industry comparisons stay fair, while you gain clearer insight into which reviews need attention.
Help on how to improve your scores
What’s changed?
We’ve added in product guidance to support you on how to improve your scores. VouchedFor now suggests actions at a firm, adviser and client level based on what we know works well for other firms and networks.
Industry Benchmarking
What’s changed?
We’ve moved from using a simple average (mean) to a percentile ranking for firms and advisers. You will now see that you are in the “top x% of firms/ advisers” rather than your average compared to the industry average.
You can also access a breakdown of scores across the percentiles so that you have context on what would be a “good score”. For each question, you can see the score for the top 1% of firms, top 25%, top 50%, top 75% and top 100%.
This offers a clearer picture of how you’re performing relative to your peers.
Networks will continue to see mean-based benchmarks, which remain more relevant for larger groups of firms.
Why is percentile ranking better?
Percentile rankings give a clearer, fairer view of performance, especially when most firms already score well, and the average doesn’t reflect real competitive standing.
To be included in rankings, firms must have at least 30 reviews for each question. This ensures scores are stable and comparisons are statistically reliable.
Fairer comparisons: Every eligible firm is weighted equally, no matter how many reviews they have. Previously, firms with lots of reviews influenced the mean far more than those with fewer reviews, leading to less representative benchmarks for smaller firms.
More meaningful: If most firms have strong scores, the average may look high - but it won’t tell you how you’re really performing against the competition.
More actionable: Moving to a rank helps you to understand your position, especially when industry scores are tightly clustered. A rank in the “top 60% of firms” means that you are only performing better than 40% of other firms - a clearer signal of where to focus your energy on being more competitive.
What does this mean for you?
Your rank might be lower than expected - even if your score is high and hasn’t changed. It reflects where you sit relative to a strong-performing industry.
For example, your score could be high, and relatively close to the industry average but if everyone has high scores, you may still have a lower rank in comparison to your peers.
Still Have Questions?
Watch our short recorded demo explaining changes
You can always reach out to VouchedFor for support, or login to your dashboard from 1st July to see it all in action.
We are committed to using your feedback to keep making Elevation better so please share your feedback via our short survey link.